Running the Altman Z-score in every FP&A loop
Edward Altman published his five-ratio bankruptcy predictor in 1968. Lenders still use it. Credit-risk desks still run it. It still works.
Most finance teams still calculate it once a year, in a footnote nobody opens. That is the wrong cadence for a model built to give 12 to 24 months of warning.
Run Z inside every FP&A loop you already run: budget, forecast, plan, report. Same five ratios. Four different decisions.
What is the Altman Z-score
A 1968 experiment that still runs
Edward Altman was an assistant professor at NYU when he asked a question that sounds obvious now and was not obvious then: does any single financial ratio predict corporate failure, or does it take a combination?
He assembled 66 manufacturers. Thirty-three had gone bankrupt between 1946 and 1965. Thirty-three had not, matched to the first group by industry and asset size. Then he ran multiple discriminant analysis across 22 candidate ratios to find which combination separated the two groups most cleanly.
Five ratios survived. Weighted and summed, they produced a single number that correctly classified 94% of the sample one year before failure. The accuracy falls off as you look further out, to roughly 72% at two years, which is worth knowing when someone tells you Z gives two years of warning. It gives one good year and a second noisy one.
The five ratios and the three bands
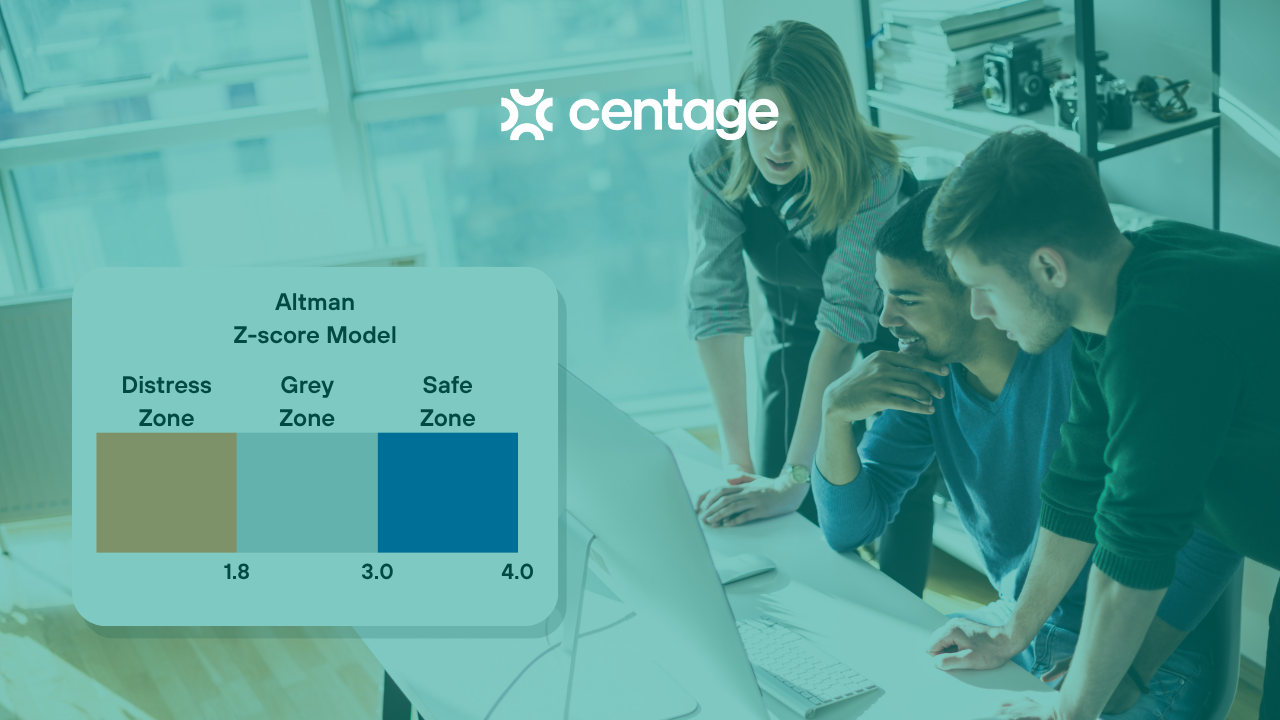
Altman's Z for a public manufacturer weights five ratios and sums them into one number:
For private companies Altman published Z', which uses book value of equity and revised coefficients. For non-manufacturers and emerging-market issuers he published Z'', which drops the Sales/Assets term because asset turnover means different things in services versus manufacturing.
Pick the variant that matches your business. Then use it four times a year.
Loop 1: the annual budget
The Z-score's job in the budget cycle is to set a solvency floor for the plan.
Compute Z on the current closing balance sheet. Compute the pro-forma Z on the budgeted year-end balance sheet. If the pro-forma Z drops more than 0.3 relative to the current-year Z, the budget's growth assumptions are moving faster than the balance sheet can absorb.
Example (illustrative, starting balance sheet: total assets $50M, MVE $30M, total liabilities $25M): a $60M distributor budgets $18M of new inventory and AR to support 25% top-line growth, funded from a short-term revolver draw (current liabilities absorb the draw, so working capital stays roughly flat while total assets and total liabilities each grow $18M). The pro-forma Z falls from 2.7 to 2.1. That drop is telling you the growth plan will spend down your covenant headroom by Q3, before the earnings improvement flows through in Q4. The board should see the number before it approves the budget.
Loop 2: the monthly forecast
Rolling forecasts already recompute revenue, gross margin, and cash. Recompute Z on the same schedule.
Each month, pull the trailing balance-sheet averages, recompute Z, and compare to two anchors: the budget-time pro-forma Z (from Loop 1) and the prior-month Z. Track two numbers: current Z, and 3-month rate of change.
The rate-of-change number is the early-warning signal. A Z that drops 0.4 in one month is a data-entry error or an acquisition; you know which one. A Z that drops 0.1 per month for three months in a row is a business trajectory. That trajectory is what Altman built the model to catch.
Loop 3: scenario planning
Base, upside, downside is where Z earns its keep.
The downside case matters most. A downside case that keeps Z above 1.81 is a case your business can survive without covenant action. A downside case that pushes Z below 1.81 is a case that triggers covenant renegotiation, changes trade-credit terms, and rewrites how a lender prices your revolver at the next amendment. Three different decisions, three different lead times.
Example: a scenario that models a 15% revenue miss and holds workforce flat (roughly 40% of the cost base is fixed labor). Z drops from 2.4 to 1.9. Every downside scenario in the deck should name a corrective action that brings Z back over 1.81: a headcount reduction of X, a receivables pull of $Y, a deferred capex line of $Z. Without one, the scenario dies in the appendix.
Loop 4: reporting
The board pack and the lender review already have a solvency page. Z belongs on it.
Three numbers: current Z, prior-quarter Z, budgeted year-end Z. One sentence of commentary when Z moves more than 0.2 in either direction. The lender's credit team already runs Z on your statements. Reporting it yourself, with your commentary attached, means your interpretation reaches the board before the lender's does.
For nonprofit and government finance teams, use Z'' and pair it with days-of-unrestricted-cash. The two together are what the audit committee needs to see.
What breaks in Excel
The obstacle is data assembly. Balance-sheet inputs live in one workbook, P&L inputs live in another, the personnel plan lives in a third, and the scenario deck rebuilds all three every quarter by hand. By the time the Z number is calculated, the underlying data has drifted.
A driver-based FP&A system recomputes Z on the same trigger that recomputes forecast revenue: any change to any driver. If the working-capital ratio moves because AR days shifted from 47 to 52, Z recomputes. If retained earnings shifts because the wage-inflation assumption changed, Z recomputes. The five ratios stop being a year-end exercise and become part of the same signal set as gross margin and cash conversion.
That is what a multiple-loop workflow does in practice. One model, one driver graph, four decisions the number informs.
The dashboard number
Current Z, three-month rate of change, and the band. Pin those three numbers to the header of your monthly close package, next to cash and revolver availability. If Z moves 0.2 between closes, someone at the executive team says why in one sentence. If it doesn't move, you get the same five seconds of confirmation that your revenue-forecast accuracy number gives you.
A signal you scan at every close, on the same page as cash. Same weight, same cadence.
If you want to see what running Z on every close looks like in a driver-based FP&A model, book a demo.
Keep reading...
Interviews, tips, guides, industry best practices, and news.
Running the Altman Z-score in every FP&A loop